Turn Any Document into Slides, Podcasts, Videos, Mind Maps, Quizzes & Data Tables — The Studio Command Center
NotebookLM's Studio panel has 9 one-click generation tools — and most people use only 1 or 2. This is the definitive reference: every tool explained with deep-dive guides, 1 free prompt per tool (9 total), generation time benchmarks, tool combination pipelines, troubleshooting fixes, and sharing workflows. Upload sources → click → get professional outputs in seconds to minutes.
NotebookLM’s Studio panel offers nine tools that turn any document into slides (about 90 seconds), Audio Overviews, video summaries, mind maps, quizzes, flashcards, reports, and data tables. Each is generated from your uploaded sources with citations, so outputs stay grounded.
TL;DR — The definitive guide to NotebookLM's 9 Studio tools. Slide Decks in 90 seconds, Audio Overviews, Video Summaries, Mind Maps, Quizzes, Flashcards, Reports, Data Tables, and Infographics — with 1 free prompt per tool, generation benchmarks, tool combination pipelines, troubleshooting, and sharing. One page, every tool.
Updated June 2026. Maintained by a small team of AI super-users who teach multi-AI research and study workflows to researchers, students, and professionals — no affiliate relationships.
Slide Decks in 60–90 sec → PPTX export. Audio Overviews in 3–8 min → podcast-style. Video Overviews in 5–10 min → AI-narrated visuals. Mind Maps in 15–30 sec → interactive. Quizzes in 20–60 sec → cited answers. Flashcards in 20–60 sec → progress saved. Reports in 30–90 sec → structured summaries. Data Tables in 30–120 sec → Google Sheets export. Infographics in 60–180 sec → 10 styles. Each tool has a free copy-paste prompt below. All available on the free plan. Full benchmarks →
All 9 Studio Tools at a Glance
Click any tool to jump to its deep-dive section with a free prompt. Generation times are typical for 5–15 source notebooks.
What Do You Need? Pick Your Path
Not sure which tool to use? Select your goal — we'll show you the exact tools and link to each section.
The 9-Tool Speed Run: From Upload to Complete Content Package in 15 Minutes
Here's exactly what happens when you generate all 9 Studio outputs from one notebook. Same sources, zero tool-switching, 15 minutes start to finish.
Performance Comparison: All 9 Tools Side by Side
Use this table to choose the right tool for your situation. Stars indicate learning curve (⭐ = easiest).
| Tool | Gen. Time | Best For | Export | Daily Cap (Free) | Ease |
|---|---|---|---|---|---|
| Mind Map | 15–30s | Conceptual overview before deep reading | Screenshot | Unlimited | ⭐ |
| Quiz | 20–60s | Self-testing, exam prep | In-app | 10/day | ⭐ |
| Flashcards | 20–60s | Spaced repetition, retention | In-app | 10/day | ⭐ |
| Report | 30–90s | Executive briefs, stakeholder updates | In-app | Unlimited | ⭐ |
| Data Table | 30–120s | Structured extraction, comparison matrices | Google Sheets | Unlimited | ⭐⭐ |
| Slide Deck | 60–90s | Presentations, defense decks, client meetings | PPTX | Unlimited | ⭐⭐ |
| Infographic | 60–180s | Visual summaries, social media, posters | Image | Unlimited | ⭐⭐ |
| Audio Overview | 3–8 min | Commute learning, podcast content, accessibility | MP3 | 3/day | ⭐ |
| Video Overview | 5–10 min | Visual explanations, sharing with study groups | MP4 | 3/day | ⭐ |
Slide Decks — Source-Grounded Presentations in 90 Seconds
Why This Tool Changes Everything
Most people spend 2–4 hours building a presentation from research. NotebookLM generates a complete, source-grounded slide deck in 90 seconds — with citations on every slide. The PPTX export contains editable text boxes, so you can refine in PowerPoint or Google Slides after generation. This is the single most popular Studio tool, and for good reason: it turns hours of work into minutes.
How It Works
Two deck formats: "Detailed Deck" produces comprehensive slides with full text — ideal for emailing or reading independently. "Presenter Slides" produces clean visuals with key talking points — ideal for live presentations with speaker notes. Choose based on whether your audience will read the slides or watch you present them.
Revise individual slides using the Pencil UI — prompt-based editing for text, layout, and visuals without regenerating the entire deck. PPTX export contains editable text boxes. Batch revisions to avoid quota limits.
Pro tip: Add a "Deck Brief" note as a source — a one-page document with your outline, audience, and key messages. This dramatically improves the structure and relevance of generated slides. Full Slide Deck Guide →
Audio Overviews — Podcast-Style Conversations from Your Sources
Why This Is the Most Underrated Tool
You can learn while walking, driving, or doing dishes. NotebookLM generates a full podcast-style conversation between two AI hosts who discuss your sources — asking questions, making connections, and explaining concepts in an engaging, conversational format. This isn't a robotic text-to-speech reading; it's a dynamic discussion that makes complex material feel approachable.
How It Works
80+ languages supported. Quality varies by language — English is best. Customize with focus instructions: specify the topic, audience, tone (enthusiastic, analytical, or conversational), and length. The hosts can emphasize different aspects of your sources based on your prompt. Download as an MP3 file for offline listening.
What most people miss: You can customize the Audio Overview before generation. Click the pencil icon and specify: "Focus on [specific topic]. Target audience: [who]. Tone: [enthusiastic/analytical/conversational]. Emphasize the practical applications over theory." This produces dramatically better output than the default.
Pro tip: Generate Audio Overviews for each chapter of a textbook, then listen to all of them in sequence during your commute. It's like having a personal tutor walk you through the material. Full Audio Guide →
Video Overviews — AI-Narrated Visual Summaries
Why Video Beats Text for Complex Topics
Visual learners, this is your tool. Video Overviews combine AI narration with visuals pulled directly from your sources — charts, diagrams, key quotes, and images. The result is a polished, watchable summary that makes dense research material accessible in a way that text alone can't match. Choose "Brief" for a 1–2 minute highlight reel or "Explainer" for a 6–10 minute deep dive.
How It Works
Video Overviews include facts, examples, quotes, and images pulled from your sources. Choose brief or long format. Tailor with a prompt specifying audience and focus. Cinematic Video (Ultra only) adds fluid animations and rich visuals. Cannot edit after generation — re-prompt and regenerate for changes.
Pro tip: Use the Brief format for social media sharing (LinkedIn, Twitter/X) and the Explainer format for study groups or team briefings. The Brief format is under 2 minutes — perfect for attention spans. Full Video Guide →
Mind Maps — Interactive Concept Visualization in 15 Seconds
Why You Should Generate This First
The Mind Map is the fastest Studio tool — and the most strategically valuable. In 15 seconds, you get an interactive visualization of the conceptual landscape across all your sources. Click any node to see the underlying evidence with citations. This is the tool that turns "I have 200 pages of PDFs" into "I can see exactly what these papers are about and how they connect."
How It Works
Mind Maps are interactive. Click any node to see the underlying evidence from your sources with citations. Best used at the START of a research session to visualize the conceptual landscape before diving into specific questions. Also useful as an intermediate step in the Table Parser pipeline for conceptual tables.
Pro tip: Generate a Mind Map immediately after uploading sources. Use it to identify which concepts are well-covered (many sub-nodes) vs. thin (few sub-nodes). This tells you where your sources are strong and where you need more material. Then generate your other outputs (Slides, Quiz, Report) using the Mind Map structure as your outline.
Quizzes — Knowledge Assessments with Cited Answers
Why Self-Testing Beats Re-Reading
The testing effect is the most well-documented learning strategy in cognitive science. Actively retrieving information (taking a quiz) produces stronger, longer-lasting memory traces than passively re-reading. NotebookLM's Quiz tool generates questions grounded in YOUR uploaded material — not generic trivia. Answers cite specific sources and passages, so you can verify and deepen understanding.
How It Works
Quiz questions are grounded in YOUR uploaded material. Answers cite specific sources and passages. Use for exam prep, self-assessment, or as part of the Knowledge OS retention engine (generate quiz in NLM → grade with Claude → targeted review). Progress is now saved across sessions — return tomorrow and pick up where you left off.
Pro tip: Customize the quiz before generation. Click the pencil icon and specify: "10 questions mixing factual recall, conceptual understanding, and synthesis across sources. Include 2 questions that require connecting ideas from different documents." This produces much harder, more useful questions than the default.
Flashcards — Source-Grounded Spaced Repetition
Why Flashcards Work When Highlighting Doesn't
Highlighting creates the illusion of learning. You recognize the text when you see it again, but you can't recall it from memory. Flashcards force active recall — you see the question and must retrieve the answer without cues. This is the difference between "I've seen this before" and "I know this." NotebookLM generates flashcards from YOUR sources with citation backing, so every card is grounded in your actual material.
How It Works
Flashcards are generated from YOUR sources with citation backing. Progress is now saved — return to the same set and it remembers which cards you've mastered. Delete individual cards you don't need. Export to Anki for advanced spaced repetition scheduling. Best paired with quizzes as a two-step retention workflow.
Pro tip: Generate Flashcards after taking a Quiz. Focus the Flashcards on the concepts you got wrong. This targeted approach is 3× more efficient than generating Flashcards for everything. For Anki users: export the cards and import into Anki for proper spaced repetition scheduling.
Reports — Structured Summaries and Executive Briefs
Why Reports Are the Hidden Workhorse
When someone asks "can you summarize this?" — this is your tool. Reports generate structured, sectioned summaries from your sources with proper citations. Unlike a chat response, a Report is formatted for reading: clear headings, logical flow, evidence presented systematically. This is the tool you use when you need to hand someone a document that explains everything without them reading the original sources.
How It Works
Reports pull key findings, arguments, and evidence from across all your sources and organize them into a structured document. Customize the focus, audience, and depth before generation. Reports work especially well for multi-source synthesis — when you need to understand what 10 papers collectively say about a topic, not what each paper says individually.
Pro tip: Use Reports for meeting preparation. Upload the agenda, background documents, and previous meeting notes. Generate a Report focused on "key decisions needed, open questions, and recommended actions." Walk into the meeting with a structured brief that took 60 seconds to generate.
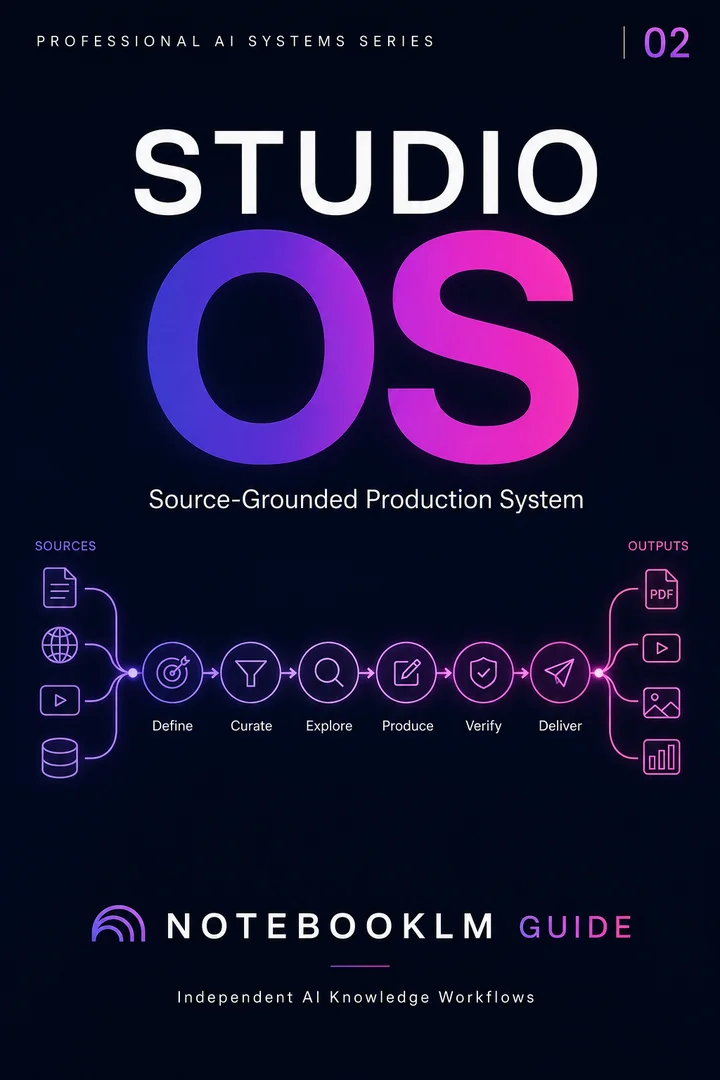
Studio Outputs
Reusable workflows for reports, slide decks, visual structures, podcasts, and presentation-ready outputs.
- Reusable workflow architecture
- Source-grounded prompt patterns
- Implementation and review steps
- One-time purchase · permanent access
Data Tables — Extract Structured Data to Google Sheets
Why Data Tables Save Hours of Manual Work
Extracting structured data from unstructured documents is the most time-consuming part of research. Reading 10 papers to build a comparison matrix of methods, findings, and sample sizes can take an entire afternoon. NotebookLM's Data Table tool does it in 60 seconds — and exports directly to Google Sheets for further analysis. This is the tool that turns "I need to compare these 15 studies" from a weekend project into a 2-minute task.
How It Works
Data Tables handle cross-source synthesis remarkably well. Specify columns in your prompt for structured extraction. Export directly to Google Sheets for further analysis. For complex ungridded textbook tables, see the dedicated Table Parser guide with the Describe-First protocol.
Pro tip: Be very specific about your column structure in the prompt. Instead of "extract data," say: "Create a table with columns: Study Author, Year, Methodology, Sample Size, Key Finding, Limitation, Relevance to [MY TOPIC]." The more specific your columns, the better the extraction. 30 Data Extraction Prompts →
Infographics — Visual One-Pagers with 10 Style Options
Why Visual Summaries Get 3× More Engagement
People process visual information 60,000× faster than text. An infographic takes the key findings from your sources and turns them into a single, shareable visual page. This is the tool for LinkedIn posts, study group handouts, conference posters, and social media content. With 10 style options, you can match the visual format to your audience and purpose.
How It Works
Infographics generate visual one-pagers with data, key points, and design elements pulled from your sources. Choose from 10 styles — timeline, comparison, process flow, statistical, and more. Customize the focus and audience before generation. The output is a shareable image that captures the essence of your sources in a format that's immediately accessible.
Pro tip: Generate an Infographic after your Slide Deck. Use the Slide Deck's structure as the content outline, and the Infographic becomes a "leave-behind" summary that your audience can take away. For social media, the Infographic format performs significantly better than text-only posts.
What People Are Building with Studio
Real results from researchers, students, and professionals using NotebookLM Studio tools.
Why Can't NotebookLM Answer My Question? Common Fixes
The 8 most frequent issues and how to resolve them
| Problem | Likely Cause | Fix |
|---|---|---|
| "I can't find that in your sources" | Answer isn't in your uploaded documents | NotebookLM only uses YOUR sources. Add the document that contains the answer. |
| Vague or generic response | Query is too broad | Be specific: "What does [Author] say about [Topic] on page [X]?" instead of "Tell me about [Topic]." |
| Source not being used | Source wasn't fully indexed | Test: ask a specific factual question about content near the end of the document. If it fails, re-upload. |
| Daily limit reached | 50 chats/day on free plan | Group related questions into single prompts. Upgrade to Plus for ~500/day. See all limits → |
| PDF text is garbled | Scanned PDF with poor OCR | Convert: Google Drive → Open with Google Docs → re-upload the Doc version. |
| Studio tool won't generate | Daily generation cap reached | Free: 3 Audio/Video per day, 10 Quizzes/Flashcards. Wait 24 hours or upgrade. |
| Slide deck looks wrong | Sources too dense or unfocused | Use fewer, more focused sources. Add a "Deck Brief" note with your outline. Slide tips → |
| Can't share notebook | Sharing settings not configured | Click Share (top-right) → invite by email (private) or generate public link. |
Sharing & Collaboration
Two sharing modes for notebooks and Studio outputs
Private sharing: Invite specific Gmail users by email, like sharing a Google Doc. Collaborators with edit access can add sources, run queries, and generate their own Studio outputs (using their own quotas).
Public sharing: Generate a public link anyone can use. A globe icon appears when publicly shared. Anyone with the link can view sources and query the notebook. Useful for course materials, team knowledge bases, and shared research projects.
Exporting Studio outputs: Slide Decks export as PPTX (editable text boxes since 2026). Data Tables export to Google Sheets. Audio and Video download as files. Reports, Quizzes, and Flashcards are accessible within the notebook. Mind Maps and Infographics are interactive in-browser — screenshot for static sharing.
9 Free Prompts Above + 29 Advanced Prompts Unlocked
You just got 1 free prompt per tool (9 total) in each deep-dive section above. The premium collection adds 29 advanced prompts with multi-tool chains, edge-case handling, and optimization techniques.
Slide Decks
5 advanced prompts
Audio & Video
4 advanced prompts
Mind Maps
3 advanced prompts
Quizzes & Cards
5 advanced prompts
Data Tables
4 advanced prompts
Multi-Tool Chains
8 pipeline prompts
One notebook, 9 output formats — the researcher who uses 3+ tools extracts 5× more value from the same sources
- Most users only know 2 tools. Audio Overview and chat. The other 7 — slides, quiz, flashcards, mind map, data table, reports, infographic — are hidden multipliers.
- Tool combinations create compound outputs. Chat extracts insights → slides present them → audio explains them → quiz tests retention. Same sources, 4× the learning.
- This guide maps which tool to use when. Instead of trying each one randomly, you match the output format to your actual need — saving time and producing better results.
Complete Studio mastery system below ↓
Unlock 29 Advanced Prompts + Multi-Tool Chains
You've already got 9 free prompts (one per tool) above. The premium collection adds 29 advanced prompts: multi-tool pipelines, edge-case handling, optimization techniques, and the full 9-Tool Speed Run prompt that generates all outputs from a single instruction.
Category Bundle — one-time access
Explore the Studio Prompt Package Connect Studio outputs to the complete workflow →Frequently Asked Questions
Are all 9 Studio tools available on the free plan?
Yes. Every Studio tool works on the free plan. The difference is daily generation caps: free gets 3 Audio/Video per day, 10 Quizzes/Flashcards, and limited Slide Deck/Infographic generations. Paid plans increase all caps. See the Performance Spec Sheet for exact numbers.
How long does each tool take to generate?
Mind Maps: 15–30 seconds. Flashcards/Quizzes: 20–60 sec. Reports: 30–90 sec. Slide Decks: 60–90 sec (up to 5 min for 30+ sources). Data Tables: 30–120 sec. Infographics: 60–180 sec. Audio: 3–8 min. Video: 5–10 min. See the Performance Comparison table above for a side-by-side view.
Can I edit slides after generation?
Yes, using Pencil UI — prompt-based editing for text, layout, and visuals per slide. PPTX export contains editable text boxes. Batch revisions to avoid quota limits.
Can I export Data Tables to Google Sheets?
Yes. One-click export to Google Sheets. Also exportable as CSV. For complex table extraction from textbooks, see the Table Parser guide.
What's the fastest way to use all 9 tools?
Follow the 9-Tool Speed Run above. Upload 3–10 focused sources, then generate in this order: Mind Map (15s) → Quiz (30s) → Flashcards (30s) → Report (60s) → Slides (90s) → Data Table (60s) → Audio (5m) → Video (5m) → Infographic (90s). Total: ~15 minutes for all 9 outputs from one notebook.
Why can't NotebookLM answer my question?
Most common: the answer isn't in your uploaded sources (NLM only uses YOUR documents). Also: source not fully indexed (re-upload), query too vague (be specific), or daily cap reached (50/day free). See the troubleshooting section above.
Can I share notebooks and Studio outputs?
Yes. Private sharing (invite by email) or public link. Slide Decks export as PPTX. Data Tables export to Sheets. Audio/Video download as files. Reports, Quizzes, and Flashcards are accessible within the notebook. Mind Maps and Infographics are interactive in-browser.
Which tool should I use for exam prep?
Quiz for self-testing → Flashcards for spaced repetition → Audio Overview for commute review → Mind Map for conceptual overview. See our Knowledge OS for the complete retention workflow including Claude grading.
Connect the four core professional systems for $69.99
Sovereign OS includes the complete Research, Studio, Content, and Multi-AI workflow library — four systems in one purchase. Bought separately, the four included systems cost $99.96. Sovereign OS is $69.99, saving $29.97, with permanent access. Exam systems are separate $24.99 packages.
Four workflows · 13 ready-to-use prompts · 7-day plan
Start with four practical, source-grounded workflows, 13 ready-to-use prompts, and a 7-day plan. Instant access. No credit card.